Making the World From Scratch
Javascript has a fun and easy-to-use way to create graphics in the browser called Canvas. Canvas has a relatively simple 2D API and a complex 3D API (webGL). I’ve been particularly interested in the 2D API because it’s simple; when I started using it I was able to create some pretty interesting and complex things quickly.
In an effort to try to understand something about 3D graphics and how they work on a computer I decided to create a globe using the 2D Canvas API. You might ask, why would you use the 2D API to create a 3D graphic like a globe? The reason I didn’t want to use the 3D API is because it does a lot of the work for you behind the scenes so you don’t really understand how the 3D object becomes a 2D image on your screen. By using the 2D API I was completely and unrelentingly involved in every step from deciding how I would represent the 3D globe data to how that data gets drawn to the screen.
Above you can see the finished idea (click and drag to rotate the globe). Scroll down to explore my process in creating the world from scratch without anything but some good old Javascript.
Points on a Circle
I started by drawing a circle to the screen. The nice thing about a sphere (the globe) is that no matter how you rotate it, its silhouette is always the same circle. I'll call this circle the globe-outline later.
Now that I had the outline of the sphere, I wanted to take some points defined by latitude and longitude and draw them in the correct place on the globe. It turns out latitude and longitude are what you would call a spherical coordinate system in math. I found this handy formula on the spherical coordinate systems wikipedia page to convert from spherical coordinates (latitude and longitude) to cartesian coordinates (x y and z).
x' = planet.radius * sin(point.longitude) *
    sin(point.latitude)
y' = planet.radius * cos(point.latitude)
z' = planet.radius * cos(point.longitude) *
    sin(point.latitude)
So we plug in the radius of our globe, the latitude and the longitude, and we get out the x y and z coordinates relative to the center of the globe.
Once you have x y and z coordinates, there’s a simple way to convert to screen coordinates which we can use to draw the points. How simple? Just ignore the z and draw the point at x y. If you don’t care about having a camera that can move and rotate in the 3D world, and you don’t care about perspective, this is the simplest possible method for drawing 3D points. It’s great because I don’t care about either of those things.
In the example, points are being drawn whether they are on the front or the back of the globe. Since in real life you can’t see the stuff on the other side of the earth, we may want to hide the stuff on the back of the globe. To do that we just take the z coordinate we were ignoring before and use it to check if a point in on the back of the globe. If a point has a negative z coordinate it’s on the back and we just ignore it.
Now, catching up with what you see to the right, I added the ability to rotate the globe vertically and horizontally. To enable horizontal rotation all I had to do was add the globe’s horizontal rotation to each point’s longitude before converting to cartesian coordinates.
point.longitude' = point.longitude +
    world.horizontal_rotation
Vertical Rotation was a bit trickier, adding the earth’s vertical rotation to each point’s latitude just made all the points move up on the earth. This doesn’t make sense because when we vertically rotate a sphere the points on the front of the globe should move up and the points on the back should move down (or vice versa). In order to achieve vertical rotation I had to perform a cartesian rotation about the x-axis on each point.
I’m not really rotating the globe, I’m just moving the points to where they should be if I were to really rotate the globe.
x = x'
y = z' * sin(world.vertical_rotation) + y' *
    cos(world.vertical_rotation)
z = z' * cos(world.vertical_rotation) - y' *
    sin(world.vertical_rotation)
Tracing the Map
To get the land masses on the globe, I manually traced a 2d map of the Earth. I made it so whenever I clicked, a point was placed on the visual center of the globe. Whenever I right-click and dragged, the earth rotated.
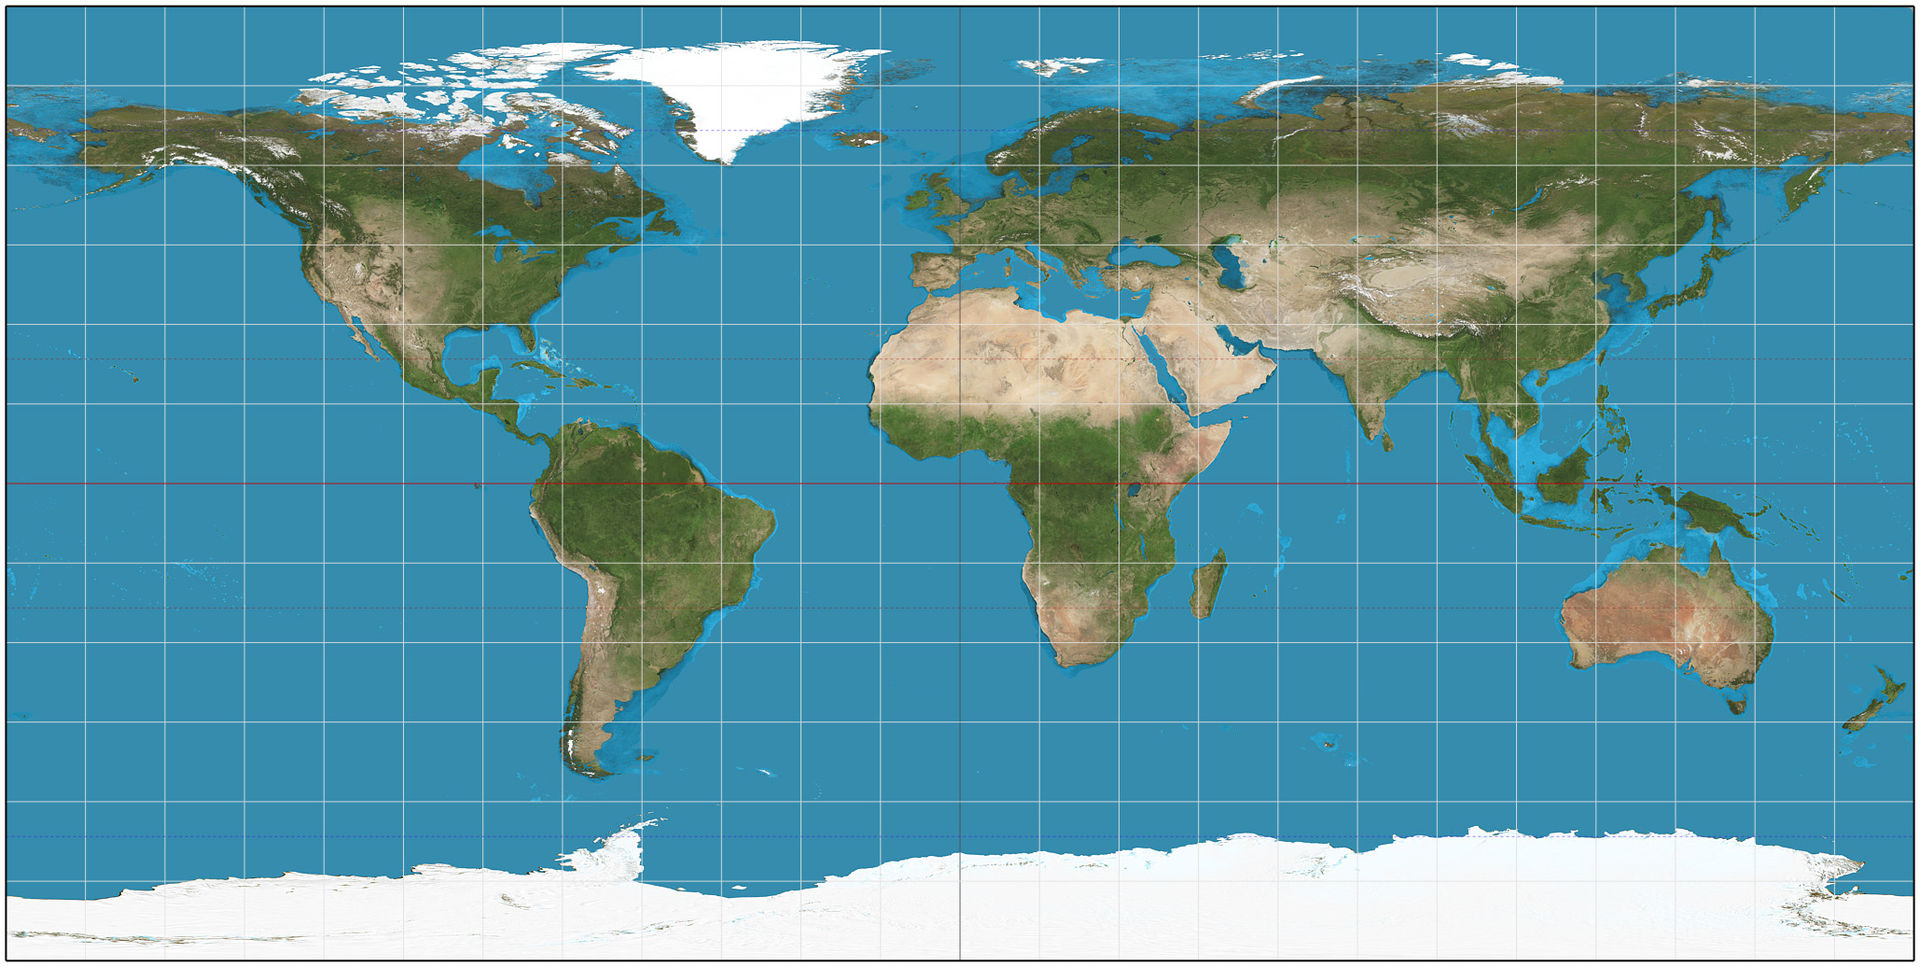
I then put an Equirectangular Projection Map of the Earth behind the globe. An Equirectangular Projection Map must be used because it is proportional to latitude and longitude, and latitude and longitude are what I'm using to represent the points on the globe. Using a different type of map resulted in stretched and distorted continents.
I made it so when I rotated the globe vertically, the map moved vertically, and when I rotated the globe horizontally, the map moved horizontally. This way, the map moved with the globe and no matter how I rotated the globe, the point on the visual center of the globe synchronized with its corresponding point on the map. With this set-up, I was able to move the map around and trace the continents, as you can see replayed in the example. As a final step, I connected the points as a path and filled it with a solid color, which is easy to do with the Canvas.
Edge of the World Problem
Awesome! Look’s great! Oh wait a sec, what was that…
An offensive straight line across the face of the globe appears on continents that are caught between the front and the back of the globe. This happens because when we ignore points on the back of the globe, the path outlining the continent starts at one point near the globe-outline, and ends at another far off point near the globe-outline. When the path is filled in it connects the starting and ending points with a visually unexpected straight line.
Another less visually obvious issue is happening here, the continents caught between the front and the back of the globe don't actually go to the edge of the globe-outline. This is because the points on the front of the globe which are the start and the end of the continent path are almost never right on the globe-outline and are probably actually a bit away from it.
So, to summarize, the problem is twofold:
1. We need to connect the points which are the start and end of the continent to the globe-outline in a visually expected way.
2. We need to arrange the path so that we completely fill in the area occupied by the land and only the land.
Edge of the World Problem Solution Part 1:
Backface Point-Radius Inversion
To the right, you can see the solution to the first sub-problem. I took all the points on the back of the globe, and instead of ignoring them, I took their screen coordinates and inverted them about the globe-outline.
Now the paths leave the globe in a natural looking way. If I masked away everything outside the globe-outline the land would go all the way to the globe-outline in a way that looks correct. The land is being completely filled in. However, as you can see, the continents on the back of the sphere warp into a grotesque shape that covers the entire globe. This won’t do, even if I mask away everything that isn’t inside the globe-outline, the continents on the back of the globe aren’t filled in correctly and often obstruct your view of the continents on the front.
The second sub-problem remains unsolved because area outside the land is sometimes being covered by green.
Edge of the World Problem Solution Part 2:
Path Clipping
Finally, the solution to both sub-problems. In this version we change the points we draw so the land is filled in correctly.
Instead of including all the inverted points on the back of the globe, for each place where a continent is caught on the edge, I include the two points on the back of the globe necessary to bridge the gap from the front of the globe to the globe-outline. In between the two points on the back of the globe on a continent's path, I add a 3rd point a ways away from the globe that ensures that the path stays outside the circle of the globe (the 3rd point is the reason it looks like spikes or triangles protruding from the earth). This allows the path to naturally transition from the front of the globe to the back, without filling in areas that are not covered by land.
The End of the World
Now, we mask away those artifacts and remove the debug markers and voila, we have the world from scratch. The road to this point was long, frustrating, and hard, but seeing it finally work was awesome and relieving. I’ve left out and abstracted away a ton of details, so if you’re curious about a more in depth look at one of the steps feel free to hit me up. I hope you found my process in creating the world interesting. Thanks for reading.